
Data Center Electricity Bill: Who Pays for AI in 2026
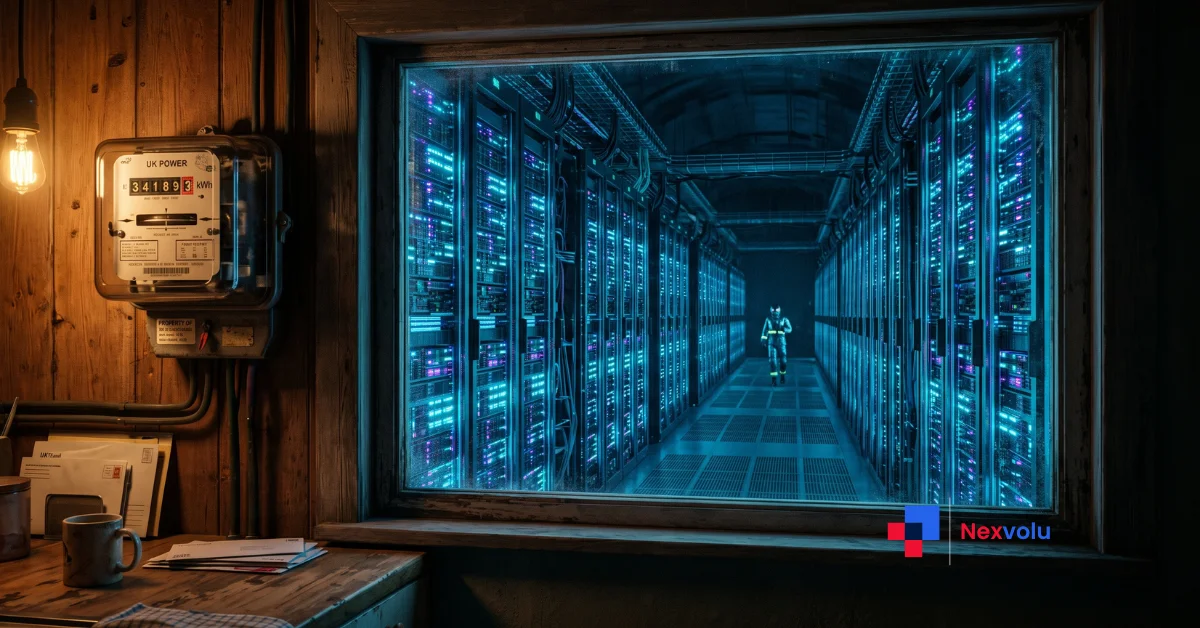
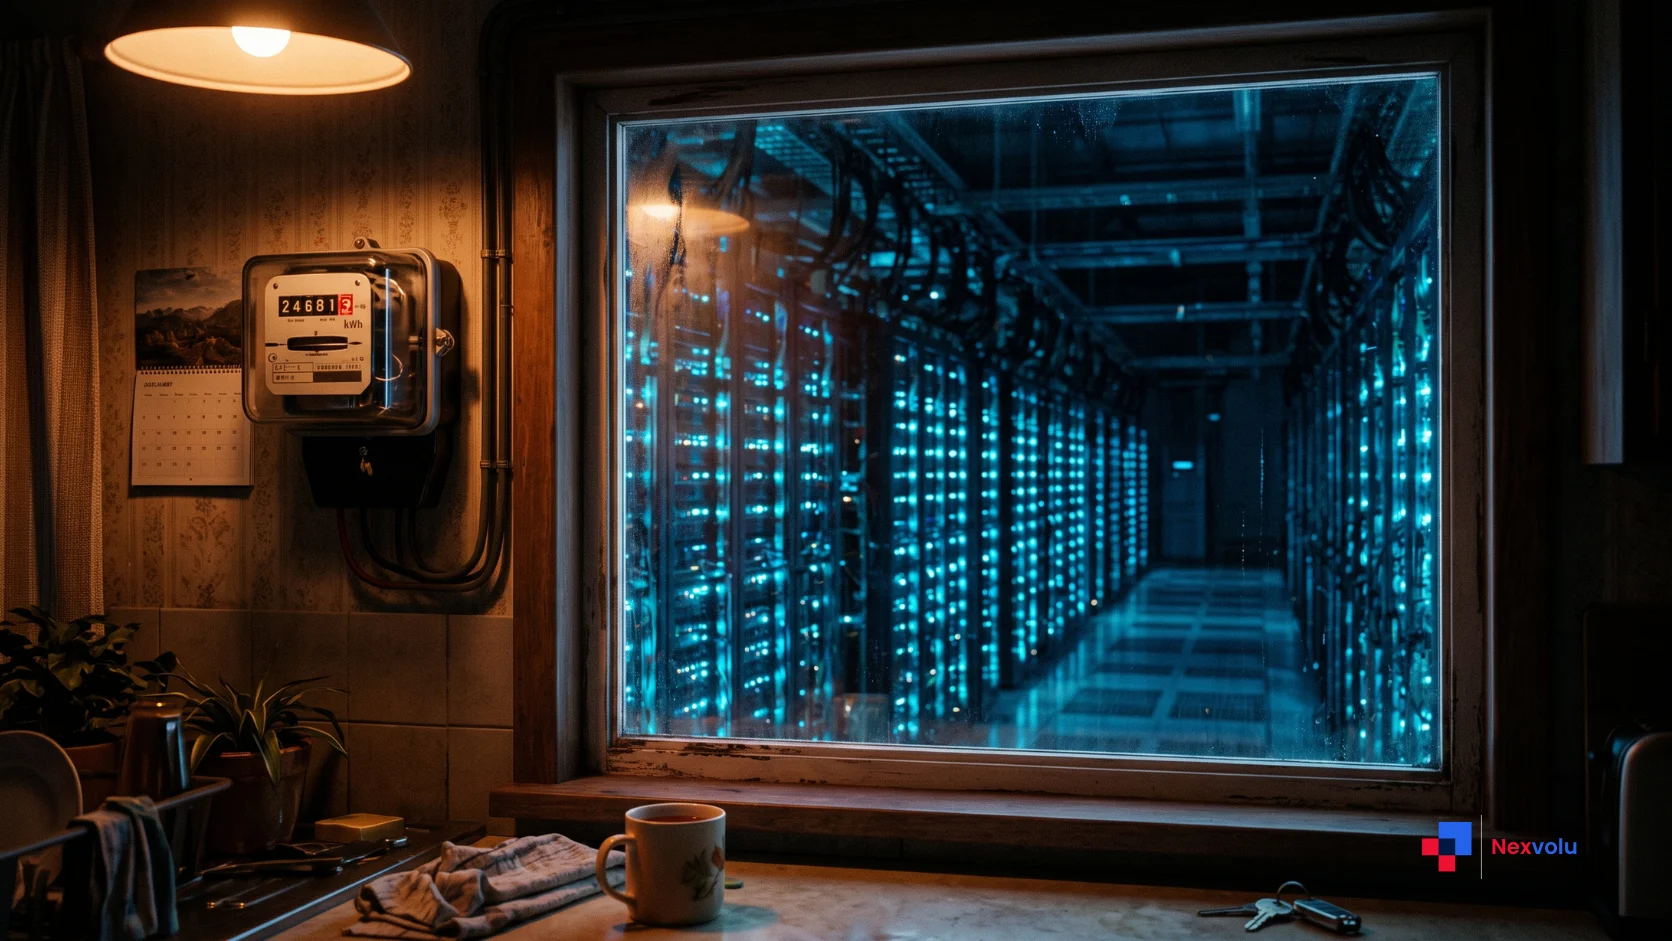
Your electricity bill has quietly become a data center electricity bill. But you never opened ChatGPT. You never trained a model. Yet the cost of the compute behind those things now arrives, in small increments, on the same statement as your fridge and your kettle.
That’s the strange part of 2026. In fact, AI stopped being a tech story this year and became a household expense story. In the US, the Energy Information Administration expects commercial electricity demand to outpace residential demand for the first time on record, with record national power use in 2026 and 2027. Meanwhile, in Britain, data centres now draw close to 6% of electricity supply.
Here’s what makes the data center electricity bill argument so slippery: for almost a decade, data centers actually pushed average residential rates down. That is the finding of a 2026 working paper from Electric Power Research Institute and Watershed researchers. But something changed around 2024, and that reversal is the real story one the energy press tells in gigawatts while the consumer press tells it in outrage, and almost nobody translates into the line items on your statement.
So that’s what this does. First, we trace the chain from a training run to your kilowatt-hour. Then we run the arithmetic for US and UK households. Finally, we finish with five steps you can act on this month.
Why is my electricity bill going up in 2026?
Your electricity bill is rising in 2026 because power demand is growing faster than supply. The EIA expects record US electricity use in 2026 and 2027, driven largely by data centers, and Goldman Sachs found electricity prices rose 6.9% in 2025 more than double the 2.9% headline inflation rate.
That gap between demand and supply is the whole mechanism. Because utilities can’t conjure a power plant in a quarter, the shortfall gets priced somewhere else instead. Grid operators, however, can run auctions that reprice scarcity almost immediately, and regulators can approve the capital spending that scarcity justifies. So both show up on your statement long before new generation shows up on the grid.
The numbers aren’t subtle. For example, EIA forecasts 2026 sales of 1,550 billion kWh to commercial customers against 1,508 billion kWh for residential. In 2025, by contrast, commercial sat at 1,493 billion and residential at 1,515 billion. Run the arithmetic and commercial demand climbs about 3.8% in a single year, while residential slips roughly 0.5%. In other words, homes are using slightly less power and paying more for it.
What a data center electricity bill really pays for
A hyperscale data center behaves like a small city that never sleeps and never shifts its load. In fact, the International Energy Agency puts a typical facility at around 100 megawatts roughly the electricity use of 100,000 households.
EIA’s Annual Energy Outlook 2026 calls data center load the dominant driver of long-term US electricity growth, and estimates servers alone accounted for about 7% of commercial-sector electricity in 2025. Similarly, EPRI’s 2026 modelling puts data centers at 4–5% of total US demand today, rising to 9–17% by 2030.
Size isn’t really the problem, though. Flatness is. Because a data center runs near maximum around the clock, the grid must be built for its peak permanently, rather than for one hot Tuesday in July. As a result, compute demand turns into capital spending and capital recovery is the part of a data center electricity bill that households actually pay.
The four-link chain: from a training run to your data center electricity bill
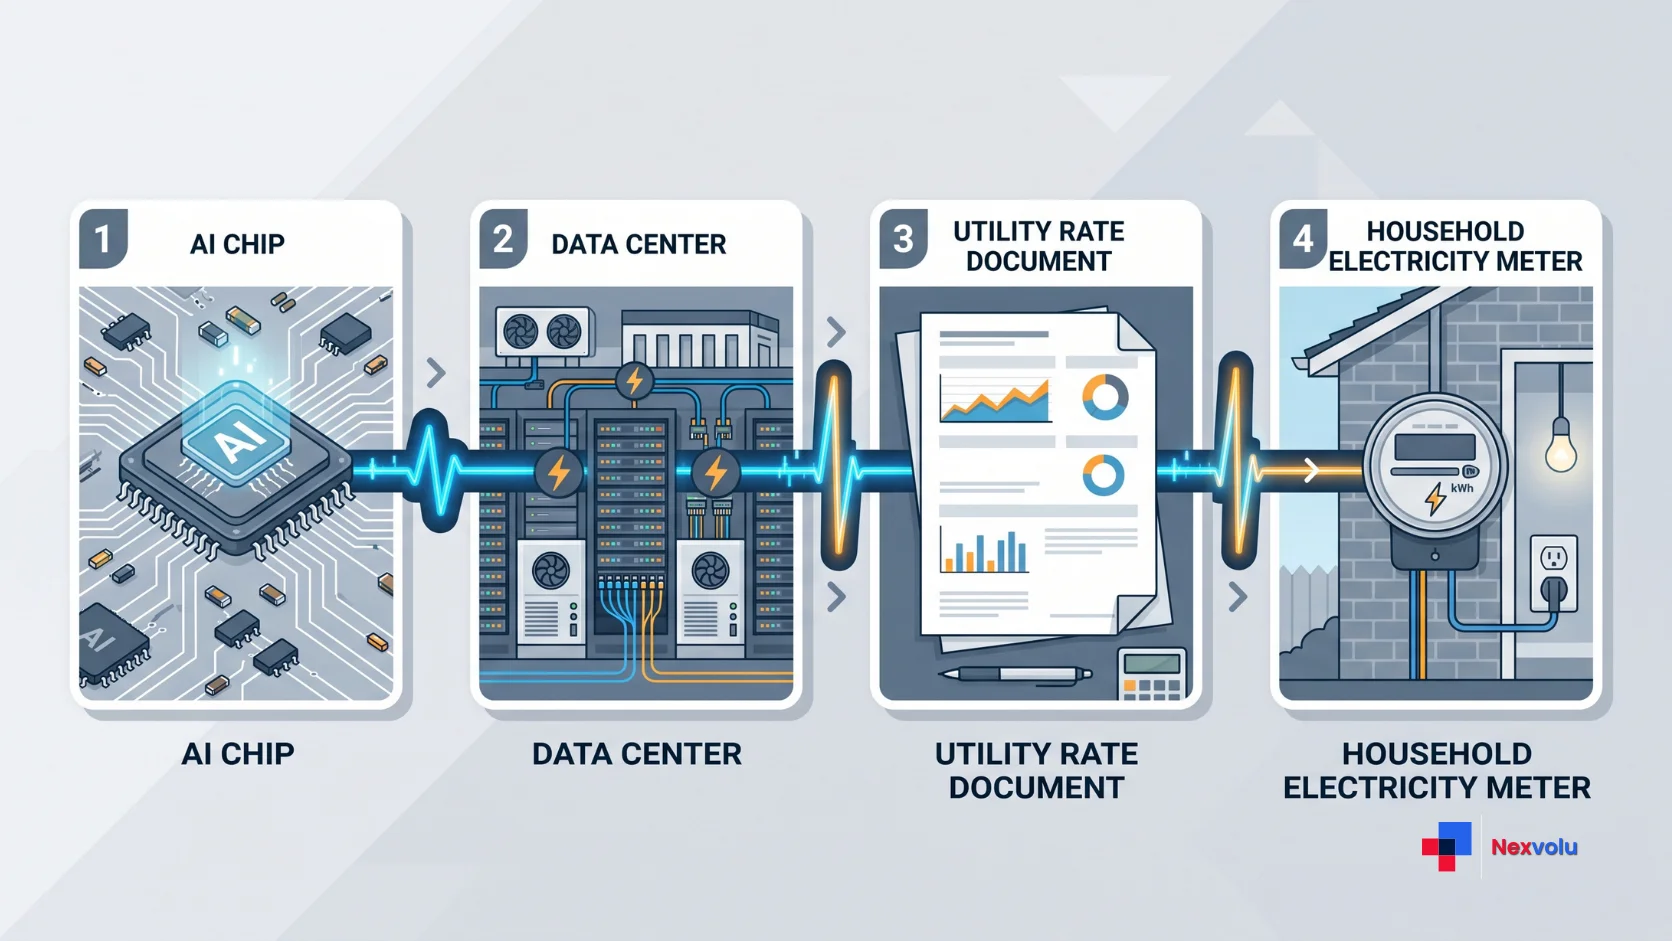
Most coverage jumps from “AI is power hungry” straight to “your bill went up” and skips the plumbing. In practice there are four links, and knowing which one is squeezing your region tells you what can be done about it.
| Link | What happens | Where it lands on your bill |
|---|---|---|
| 1. Compute demand | Training and inference commit operators to firm, round-the-clock load | Nothing yet – this is the signal |
| 2. Siting and interconnection | Operators queue for connections, concentrating load in a few regions | Regional supply and congestion costs |
| 3. Wholesale and capacity markets | Auctions reprice scarce capacity; gas burn rises to fill the gap | Supply or energy charge, capacity pass-throughs |
| 4. Rate cases and network build | Utilities recover new lines, substations and returns on capital | Delivery, transmission, standing or fixed charges |
Still, only links three and four reach your data center electricity bill directly, which is why regional detail beats national averages every time.
Link three: why capacity auctions moved first
Link three is where 2026 gets brutal. PJM Interconnection, for instance, serves about 67 million people across 13 states and Washington DC, and its capacity prices went from $28.92 per megawatt-day in 2024/25 to $329.17 in 2026/27 – an 11-fold jump. PJM’s independent market monitor attributes roughly $29 billion in added regional costs since 2024 to data centers, including $6.3 billion from the auction held on 30 June 2026.
Divide that $29 billion across PJM’s 67 million residents and you get about $433 per person over the period. Admittedly that is crude, since business and industry carry part of it, but it lands in the right order of magnitude. The recent $6.3 billion, meanwhile, works out near $94 per person, or roughly $235 per household of two and a half people.
Link four: gas, wires and rate cases
Link four is quieter and permanent. Gas is the swing fuel, so EIA forecasts power-sector gas use rising 2% in 2026 and 4% in 2027, to a record 38.1 billion cubic feet per day. And when gas sets the price, gas volatility becomes yours.
When a data center electricity bill worked in your favour
Yes, it once did, and this is the fact viral posts leave out. The 2026 EPRI and Watershed working paper used an instrumental-variables approach and found data centers caused average US residential rates to fall modestly between 2015 and 2024. Notably, doubling a state’s data center capacity was associated with roughly a 3.5% decrease in residential rates, holding household use constant. Marketplace covered it in July 2026 with the right caveat: for now.
Why rates fell for a decade
The economics were simple. Grids carry enormous fixed costs – poles, wires, substations, billing systems. So if you add a customer that consumes vast power at a steady rate, those fixed costs spread across more kilowatt-hours, and average cost per unit drops. British analysts make the same argument today; for instance, one estimate suggests the government’s 6 GW ambition by 2030 could shave around £2 billion a year off UK bills through that dilution effect.
Why the discount reversed
For a decade, then, there was a data center electricity bill effect that ran in your favour. Three things flipped it, and they compound:
- Spare capacity ran out. Before 2024, new load largely filled existing headroom. Now, however, it needs new generation and wires, priced at 2026 construction and financing costs rather than 2015’s.
- Scarcity markets reprice instantly. Capacity auctions respond to forecast demand in months, while power plants take years. That timing gap is therefore pure price increase.
- Growth concentrated geographically. Northern Virginia, Ohio and Texas absorbed much of the load. Dilution works when demand spreads thin; it fails when demand stacks on one substation.
In short, data centers were a bargain for ratepayers while the grid had slack, and became a cost the moment it didn’t. Fortune reported in May 2026 that they’re also a convenient scapegoat – PowerLines founder Charles Hua noted they aren’t the biggest reason bills rose over five years, since storm damage, an ageing grid and utility capital programmes are all in the mix.
Your data center electricity bill in the US in 2026
Three numbers frame a US data center electricity bill this year. First, residential electricity averaged 6.2% more per kWh in May 2026 than a year earlier, according to EIA’s Electricity Monthly Update. Second, all-sector average revenue sits at 13.83 cents/kWh. Third, residential prices are projected near 18 cents/kWh for 2026, against roughly 13.5 cents for commercial customers.
Set that against a household using about 10,500 kWh a year and annual electricity costs land near $1,890. So a 6.2% year-over-year rise is roughly $110 more than the same usage cost twelve months earlier about $9 a month. Modest alone, of course. Layered on prices already up around 40% nationally since February 2020, and 93% in Washington DC between July 2020 and July 2025, it bites.
Where a data center electricity bill hits hardest
Exposure is intensely regional. Bloomberg’s 2025 analysis, for example, found wholesale power costing up to 267% more than five years earlier in areas near data centers. Similarly, Consumer Reports noted that nearly three-quarters of Virginia voters now blame the facilities for rising costs.
Large-load tariffs: the fix that moved actual rates
These create a separate rate class, so data centers pay their own way. AEP Ohio’s version, for instance, covers customers above 25 MW, requires payment for at least 85% of contracted capacity whether used or not, and locks in 12-year minimum contracts. Oregon went furthest: under its 2025 POWER Act, regulators approved a Portland General Electric filing raising data center rates about 29% while cutting residential rates 1.3%. That is the first clean example of the cost being pushed back where it started.
The Ratepayer Protection Pledge: fast but voluntary
Announced by the White House on 4 March 2026, the pledge commits major hyperscalers to fund the generation and delivery infrastructure their projects need, and to pay negotiated rates whether or not they use the power. By July 2026, the White House said the expanded pledge covered 80% of all power delivered to US homes and businesses. Still, it is voluntary and that is both its speed and its weakness.
Your data center electricity bill in the UK in 2026
UK data centres use about 5.9% of national electricity supply, against 6% in the US and a 2% global average, according to research reported by the Guardian in May 2026. Government figures in early 2025 put the UK share at 2.5% and predicted a fourfold rise by 2030 – a forecast the sector is already outrunning.
Why the standing charge is the line to watch
A UK data center electricity bill hides the cost in a different line than an American one. Under the Ofgem price cap for 1 April to 30 June 2026, for example, a direct-debit customer on a standard variable tariff pays 24.67p per kWh plus a daily standing charge of 57.21p. Multiply that standing charge by 365 and you get £208.82 a year before switching on a single light. Then, for a household using the typical 2,700 kWh, total electricity lands near £875 which means fixed charges are close to 24% of the bill.
Why does that matter for AI? Because network costs – the grid reinforcement that data centre growth accelerates are recovered largely through those fixed charges. In the UK, therefore, the buildout is more likely to reach you through the standing charge than the unit rate.
The connection queue and Ofgem’s deposit
The queue is the headline UK number. Contracted offers in Great Britain’s demand connections queue rose from 41 GW in November 2024 to 125 GW by June 2025 nearly three times GB’s peak demand of around 45 GW. Roughly 140 data centres, totalling about 50 GW, sit in that queue.
Ofgem’s response, published on 29 July 2026, is a refundable connection deposit of £237,500 to £712,500 per megawatt. So apply the midpoint to 50 GW of queued demand and you get roughly £24 billion in deposits – a measure of how much of that queue Ofgem suspects is speculative. There are 564 data centres listed in the UK, and local opposition is now loud enough to shape planning outcomes.
The Nexvolu Bill Exposure Score: rate your data center electricity bill risk
National averages are useless for personal decisions. So score your own exposure with this framework we built for the piece – one point per “yes.”
- Do you live in a capacity-market region (PJM, MISO, ISO-NE, NYISO) or in Great Britain?
- Is there an announced data center cluster inside your utility’s service area?
- Has your utility filed a general rate case in the last 18 months?
- Does your state or country still lack a separate large-load or data centre rate class?
- Do fixed charges make up more than 20% of your bill?
- Finally, are you on a flat rate with no time-of-use option, despite one being available?
0–2: low exposure. Your increases are mostly fuel costs and general maintenance.
3–4: moderate exposure. You’re paying some share of regional buildout. As a result, rate-plan optimisation and load shifting will do more for you than politics.
5–6: high exposure. You’re in the path of the cost shift, so commenting on rate cases genuinely changes your future bill. Oregon households got a 1.3% cut because that fight was fought.
Found this useful? Share it with someone who’s been staring at their power bill wondering what changed.
Five ways to cut your data center electricity bill
Most advice on this topic ends at “be aware.” But that isn’t an action. These five, by contrast, work on the parts of the bill you can still move.
- Audit your rate plan, not just your usage. First, confirm which tariff you’re on. Many households sit on default plans while cheaper time-of-use options go unclaimed.
- Shift your three biggest loads off peak. Laundry, dishwasher, EV charging and hot water are the movable ones. So on a time-of-use plan, that’s real money.
- Read the fixed charges line. Work out what share of your bill the standing or customer charge is, since that’s the line grid buildout travels down and the number to quote when you complain.
- Comment in your utility’s rate case. US state commissions and Ofgem consultations must accept public comment; for example, Ofgem’s data centre connection consultation ran to 16 September 2026. These windows are short, public and badly under-used.
- Log your own kWh baseline monthly. One photo of the meter on the first of each month. Otherwise, you can’t tell a rate hike from a hot summer.
Bookmark this and come back when your next bill lands – rate cases decided in late 2026 will show up on statements well into 2027.
Nexvolu’s Verdict
The verdict: a data center electricity bill is a rate-design problem, not a technology one. The AI buildout is a good deal for the grid but a badly structured deal for households, and the fix is therefore boringly administrative.
Best for: regions with slack capacity and enforced large-load tariffs.
Skip the optimism if: you’re in PJM or a rate case-heavy state where nobody local can name the tariff class.
Pros: Data centers diluted fixed costs for a decade and could again · Oregon’s 29% data centre increase alongside a 1.3% residential cut proves the cost can be reassigned · Onsite generation is scaling fast, since Bloom Energy’s 2026 survey points to more facilities planning their own primary power.
Cons: Voluntary pledges carry no enforcement · Capacity markets reprice in months while generation takes years, so households absorb the gap · Costs hide in delivery and standing charges almost nobody reads.
Standout: the reversal, not the rise. Data centers lowered rates roughly 3.5% per doubling of state capacity through 2024. Yet the same facilities now raise them because the grid ran out of slack, not because the technology changed.
Nexvolu Editorial Score: 4/10 – scored on how well households are currently protected from AI infrastructure costs. The tools exist and a few states use them, but most ratepayers still absorb costs by default.

Frequently Asked Questions
How much does a data center electricity bill add to mine?
In supply-constrained regions it adds real money, while elsewhere it historically subtracted. EPRI and Watershed researchers found data centers modestly reduced average US residential rates from 2015 to 2024. However, PJM’s market monitor attributes about $29 billion in added regional costs since 2024 to data center demand – roughly $433 per resident across the period.
The deciding factor is local headroom. So if your grid needs new generation to serve the load, you pay through delivery and capacity charges. If, on the other hand, the load fits existing capacity, it spreads fixed costs across more units and helps you.
How much more will electricity cost in 2026?
US residential electricity averaged 6.2% more per kWh in May 2026 than a year earlier, per EIA data, with residential prices projected near 18 cents/kWh. So for a household using 10,500 kWh annually, that’s roughly $110 more than the same usage cost twelve months earlier.
Goldman Sachs found prices rose 6.9% in 2025 – over double the 2.9% inflation rate and expects further increases through the end of the decade, since data centers drive about 40% of demand growth. The bank also estimates higher power prices will drag around 0.2 percentage points off consumer spending growth in 2026 and 2027.
Why did US commercial electricity demand overtake residential in 2026?
Commercial demand overtook residential for the first time on record because data centers sit in the commercial category. EIA forecasts 1,550 billion kWh of commercial sales against 1,508 billion residential, reversing 2025’s split of 1,493 billion commercial and 1,515 billion residential.
The direction of each line is what’s striking. Commercial demand rose about 3.8% year over year, while residential fell roughly 0.5% on efficiency gains. In other words, households consume less electricity than a year ago and still pay more per unit.
Which US regions have the highest data center electricity bill risk?
PJM Interconnection is the most exposed, covering 13 states plus Washington DC and about 67 million people. Its capacity price rose from $28.92 per megawatt-day in 2024/25 to $329.17 in 2026/27. Northern Virginia, Ohio and parts of the mid-Atlantic carry the heaviest concentration.
ERCOT in Texas is the other hotspot. In vertically integrated states with no capacity auction, by contrast, exposure arrives later through rate cases.
How much UK electricity do data centres use?
UK data centres use about 5.9% of national electricity supply, according to research reported by the Guardian in May 2026 – close to the US figure of 6% and well above the 2% global average. The UK government estimated 2.5% in early 2025 and predicted a fourfold increase by 2030.
Forward pressure is bigger than current draw. For example, Great Britain’s demand connections queue grew from 41 GW in November 2024 to 125 GW by June 2025, with roughly 140 data centres representing about 50 GW – more than GB’s peak demand of around 45 GW.
Does the White House Ratepayer Protection Pledge actually lower my bill?
The pledge does not lower existing bills. Instead, it commits participating companies to fund new generation and delivery infrastructure for their own data centers, and to pay negotiated rates whether or not they use the power, so future costs aren’t passed to households.
Announced on 4 March 2026 and expanded in July to cover 80% of power delivered to US homes and businesses, it is voluntary rather than regulatory. Enforceable protection therefore still comes from state large-load tariffs – Oregon’s POWER Act produced an actual 1.3% residential rate cut, while a pledge, by design, cannot.
Will building more data centers eventually make electricity cheaper again?
It can, if generation catches up with demand. The mechanism that lowered rates through 2024 – spreading fixed grid costs across far more kilowatt-hours – still works whenever new supply arrives alongside new load rather than years behind it. Still, the catch is sequencing: data centers connect in two to three years, while large generation and transmission take five or more.
The bottom line on your data center electricity bill
A data center electricity bill is regional before it is national, which is why averages say almost nothing about your own statement. Your bill is rising for several reasons at once, and although AI is a real one, it isn’t the only one. And the fixed-charge line deserves attention it never gets, because that’s where infrastructure costs quietly settle.
So the practical move this month is small: check your rate plan, photograph your meter, and find out whether your regulator has a large-load tariff on the table. Oregon households got a rate cut out of that fight. Most people, though, don’t know the fight exists.
Which part of your bill went up most this year the unit rate or the fixed charges? If this helped, pass it to one person who’s been quietly baffled by their power bill, or subscribe to the Nexvolu newsletter for the next rate-case update.
References
Where the data center electricity bill numbers come from: EIA and Goldman Sachs
- EIA, Short-Term Energy Outlook – https://www.eia.gov/outlooks/steo/
- EIA, Annual Energy Outlook 2026 press release (8 April 2026) – https://www.eia.gov/pressroom/releases/press587.php
- EIA, Electricity Monthly Update, End Use – https://www.eia.gov/electricity/monthly/update/end-use.php
- EIA, Today in Energy: servers and commercial electricity – https://www.eia.gov/todayinenergy/detail.php?id=67704
- Reuters, “US power use to beat record highs in 2026 and 2027 as AI use surges, EIA says” (7 July 2026) – https://www.reuters.com/business/energy/us-power-use-beat-record-highs-2026-2027-ai-use-surges-eia-says-2026-07-07/
- CNBC, Goldman Sachs on electricity prices and inflation (12 February 2026) – https://www.cnbc.com/2026/02/12/electricity-price-data-center-ai-inflation-goldman.html
- Goldman Sachs Research, AI power costs and consumer spending (11 February 2026) – https://www.gspublishing.com/content/research/en/reports/2026/02/11/cefdda9f-3b7c-4a53-9950-dfcfa3c6bbc2.html
Capacity markets, PJM and the EPRI research
- The New York Times, PJM electricity prices and data centers (14 July 2026) – https://www.nytimes.com/2026/07/14/business/energy-environment/pjm-electricity-prices-data-centers.html
- IEEFA, projected data center growth and PJM capacity prices – https://ieefa.org/resources/projected-data-center-growth-spurs-pjm-capacity-prices-factor-10
- EPRI, Powering Intelligence: load growth – https://powering-intelligence.epri.com/load-growth.html
- EPRI and Watershed working paper on data centers and retail electricity rates (2026) – https://arxiv.org/pdf/2606.19777
- Marketplace, “Data centers lowered electric bills in some places – for now” (10 July 2026) – https://www.marketplace.org/story/2026/07/10/data-centers-lowered-electric-bills-in-some-places-for-now
US consumer and business reporting
- Fortune, electricity bills and data centers (20 May 2026) – https://fortune.com/2026/05/20/electricity-bills-surging-not-just-data-centers/
- Bloomberg, AI data centers and electricity prices (29 September 2025) – https://www.bloomberg.com/graphics/2025-ai-data-centers-electricity-prices/
- Consumer Reports, AI data centers investigation – https://www.consumerreports.org/data-centers/ai-data-centers-impact-on-electric-bills-water-and-more-a1040338678/
- The Washington Post, power costs and data centers (15 January 2026) – https://www.washingtonpost.com/climate-environment/2026/01/15/power-electricity-cost-data-centers/
UK sources: Ofgem, Parliament and the connection queue
- The Guardian, datacentres using 6% of electricity supply in the UK and US (13 May 2026) – https://www.theguardian.com/technology/2026/may/13/datacentres-electricity-consumption-uk-us-ai
- Ofgem, energy price cap 1 April to 30 June 2026 – https://www.ofgem.gov.uk/news/changes-energy-price-cap-between-1-april-and-30-june-2026
- Ofgem, acting to free grid capacity and tackle speculative data centre projects (29 July 2026) – https://www.ofgem.gov.uk/press-release/ofgem-acts-free-grid-capacity-tackling-speculative-data-centre-projects
- BBC News, data centre grid connection deposits (29 July 2026) – https://www.bbc.co.uk/news/articles/c9q90q9qnn2o
- House of Commons Library, data centres briefing CBP-10315 (27 May 2026) – https://commonslibrary.parliament.uk/research-briefings/cbp-10315/
- Oxford Economics, the UK’s data centre boom – https://www.oxfordeconomics.com/resource/the-uks-data-centre-boom-growth-trends-drivers-and-the-rising-power-challenge/
US policy, tariffs and expert commentary
- The White House, Ratepayer Protection Pledge (4 March 2026) – https://www.whitehouse.gov/releases/2026/03/ratepayer-protection-pledge/
- The White House, expanded Ratepayer Protection Pledge (July 2026) – https://www.whitehouse.gov/releases/2026/07/president-trumps-ratepayer-protection-pledge-secures-american-ai-dominance-protects-consumers/
- The Guardian, US tech companies’ energy cost pledge (4 March 2026) – https://www.theguardian.com/us-news/2026/mar/04/us-tech-companies-energy-cost-pledge-white-house
- Oregon PUC Order 26-154 – https://apps.puc.state.or.us/orders/2026ords/26-154.pdf
- Statesman Journal, Oregon data center rate decision (2 July 2026) – https://www.statesmanjournal.com/story/news/politics/2026/07/02/oregon-data-center-rate-hike/90777099007/
- Columbia Climate Law Blog, large-load and clean transition tariffs (2 June 2026) – https://blogs.law.columbia.edu/climatechange/2026/06/02/data-center-regulation-what-local-governments-should-know-about-large-load-tariffs-and-clean-transition-tariffs/
- Bloom Energy, 2026 Data Center Power Report – https://www.bloomenergy.com/news/data-centers-plan-to-reduce-reliance-on-grid-finds-bloom-energys-2026-power-report/
- IEA, Energy and AI: energy demand from AI – https://www.iea.org/reports/energy-and-ai/energy-demand-from-ai
- Utility Dive, electricity prices and demand in 2026 – https://www.utilitydive.com/news/electricity-prices-demand-to-continue-rising-in-2026-eia/805395/
- Penn State, Ask an Expert: are data centers driving my electricity bills? (7 July 2026) – https://www.psu.edu/news/research/story/ask-expert-are-data-centers-driving-my-electricity-bills
This article is for general informational purposes only and is not financial advice. Energy prices, tariffs and regulations vary by state, region and supplier – check your own bill and your regulator’s published rates before making decisions.


